Entries Tagged 'visualization' ↓
November 12th, 2008 — art, design, economics, mobile, programming, social media, software, travel, trends, visualization

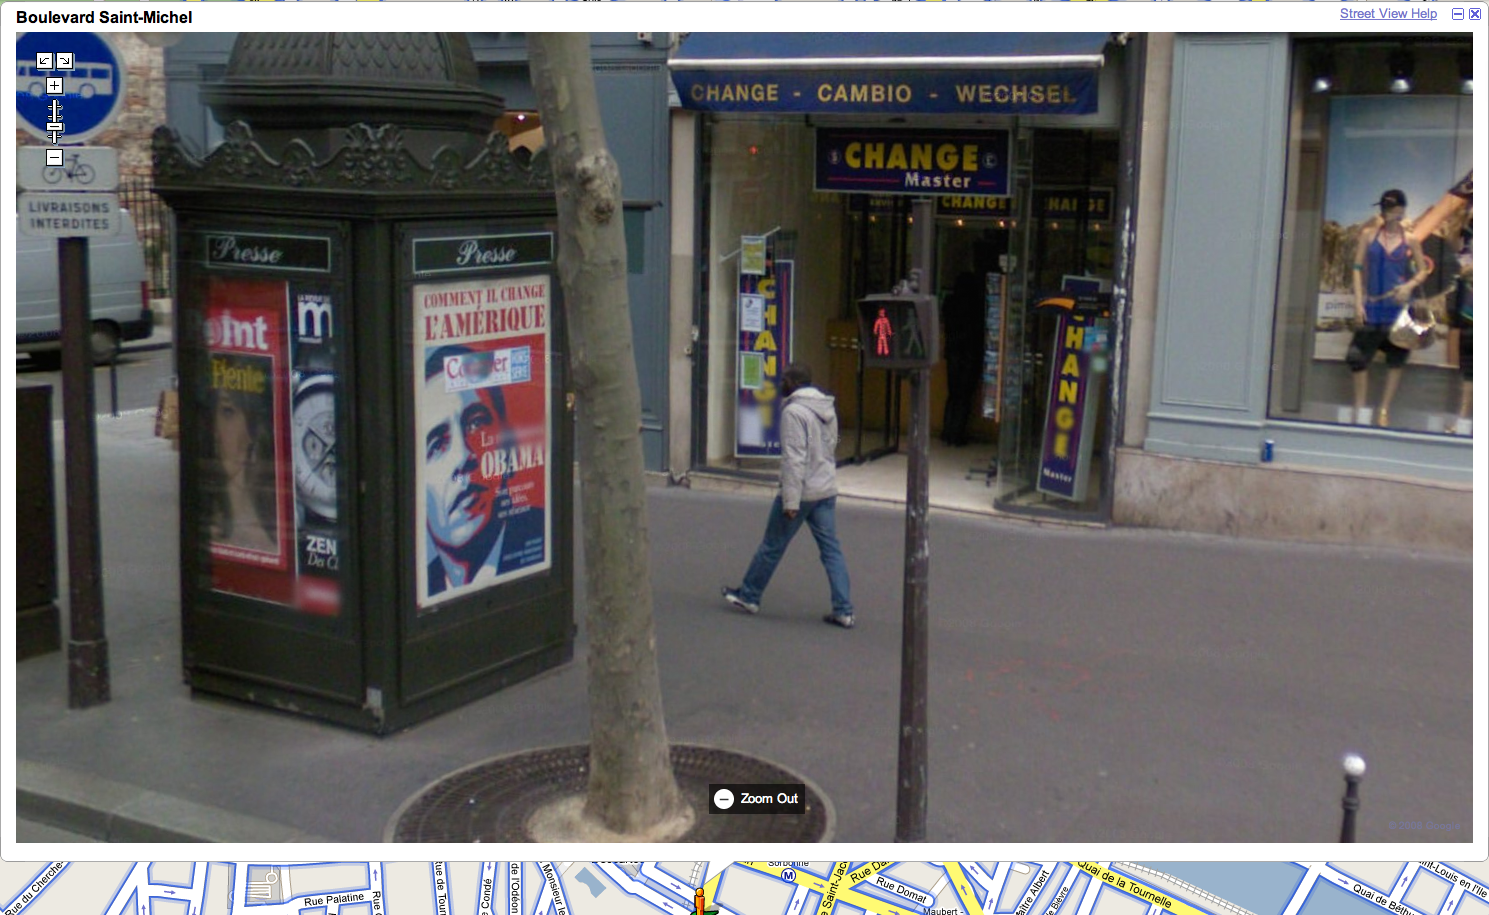
Boulevard St. Michel, Paris, Google Streetview
So many wonderful things going on in this photo, and it’s all entirely unintentional. With such a vast quantity of visual data collected for Google Streetview, how many “artistic” scenes lurk within it? How might one build a machine for finding the art within this dataset? Can it be crowdsourced?
Want to work on this with me? If so, ping me.
October 31st, 2008 — baltimore, design, iPhone, mobile, politics, programming, ruby, social media, socialdevcamp, software, trends, visualization, voip
Being busy seems to always come in spurts for me… just when it looks like I’ve got too much to do already, something cool turns up and takes things to whole new level of busy.

That would be this week. SocialDevCamp East, the barcamp-style unconference that I started with some friends last spring is back tomorrow, and that’s certainly required some coordination and planning. That would have been plenty. We have over 200 RSVP’s now (between the Wiki and Facebook) and we expect a truly incredible day of networking and learning. See you tomorrow!
The other big news of the last two weeks has been the TwitterVoteReport project, for which I’ve been acting as defacto CTO since about October 18th. This is a great project, a great cause, and an awesome idea. The data we collect will be an archival quality primary source document for future generations to study the evolution of the election process.
We have five distinct data sources coming in about people’s experience at their polling places: Twitter, Telephone, Direct SMS, and Apps for Android and iPhone. These are all normalized and aggregated into a single database and reviewed by humans for maximum accuracy. The data will then be made available in real time to anyone who wants it — from the media to watchdog groups to mapmakers — to help the world understand and monitor the 2008 US elections.


Putting this project together, with all these diverse inputs, has been a monumental task and a real demonstration of what’s possible when people decide to work together. We had over 600 phone channels donated. We were able to think up, code, and submit an iPhone app in just 3 days. We’ve received press coverage far and wide from sources as diverse as TechCrunch and Fox News. Not bad for a few days’ work.
There’s plenty more to do still (between now and Monday), and I’m busy all day tomorrow at SocialDevCamp. We’ll do a session there on TwitterVoteReport and what we’re up to… we still need more help from people good with maps!
I’ll post more here as things evolve, and a recap next week, but remember, nothing’s impossible when caring people dedicate themselves to a common endeavor.
Meantime, check out:
And watch for news about TwitterVoteReport.com on NPR and in the Baltimore Sun (in addition to myriad other outlets!)
September 26th, 2008 — art, design, economics, politics, programming, rails, ruby, social media, software, trends, visualization
An hour or so ago I launched Twittervision Election View, allowing viewers to see posts to Twitter about the 2008 election in their original geographic context.
Twitter launched something similar this morning, and the idea to do a political view of Twittervision has been around for a while, so it seemed natural to try to do this now and especially in advance of tonight’s debate.
We have some enhancements planned, and right now the site is getting a ton of traffic as people discover it… we should be able to put some more server capacity on it which should keep things steady.
Let me know what you think!
September 10th, 2008 — art, baltimore, business, design, economics, mobile, programming, ruby, social media, socialdevcamp, software, trends, visualization

In May, several of us put together SocialDevCamp East at University of Baltimore. It was an incredible day, filled with deep technical content as well as excellent discussions of business strategy and the very real challenges that east coast companies face breaking into the consumer-facing Internet space.
The day was universally hailed as a success, and maybe even a little bit of a breakthrough: for the first time, the “Amtrak corridor” tech communities had come together to face the challenges of the future together as a unified ecosystem, not just as individuals. The result was a phenomenal mixing of technical, business, and artistic topics and in my mind, was a glimpse of the future.
So, we’re back at it on November 1st, 2008. You can sign up on the barcamp wiki or on Facebook.
We’re looking forward to another great event, and another awesome afterparty at Brewer’s Art. Go ahead and start your juices flowing for what sessions you would like to see, and post them to the Wiki.
We’re also looking for sponsors for both the event and the after party. To find out more, please contact us.
See you in November in Baltimore!


